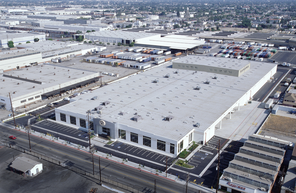
Vernon, An Economic Engine
In 2008, the City of Vernon commissioned the Los Angeles County Economic Development Corporation (LAEDC) to estimate the impacts on L.A. County attributable to activities carried on by Vernon businesses, City government, and the public and private sector employees who work in Vernon.
In short, the study found that Vernon’s economic reach extends beyond its borders to the rest of the Los Angeles region in a significant way.
Key Findings in the LAEDC Study Included:
• Vernon-based economic activity provides significant support to the regional economy:
• 105,500 Total (direct and indirect) jobs
• $41,577 Average annual employee earnings in the City of Vernon
• $4.48 Billion in annual direct and indirect wages and salaries
• $1.12 Billion in annual direct and indirect taxable spending
• $3.43 Million in annual direct and indirect government revenues
• About 44,900 private sector employees work in Vernon, representing 1.3% of Los Angeles County
• Vernon plays a significant role in several key L.A. County industries:
• 15.3% of its food industry employment
• 10.7% of its apparel related employment
• 5.5% of its furniture industry employment
• 3.4% of its fabricated metal industries employment
• The spending of Vernon's firms and its employees indirectly support sales, and therefore jobs, at firms located elsewhere in the region.
• Construction contractors working on projects in Vernon purchase goods and services from throughout the region, supporting more indirect jobs.
The impressive LAEDC “Vernon Economic Impact Study” can be viewed in its entirety here.
Jobs, Earnings and Spending
Economic activity in Vernon creates jobs in two ways:
1. DIRECTLY (workers on the payrolls of business firms located in the City). Vernon’s 44,900 employees based in the City support 58,000 additional indirect jobs throughout the Los Angeles region, for a total employment impact of 102,900 jobs.
2. INDIRECTLY (people holding jobs supported by buying decisions associated with Vernon, including spending by Vernon based firms and by Vernon’s direct workers). The indirect workers are employees of the firms that supply Vernon’s businesses with goods and services and also of the firms that supply consumer goods and services to Vernon’s workers.
The total amount paid out annually in wages and salaries by Vernon-based industrial firms, their suppliers, and the suppliers of consumer goods and services purchased by their employees is close to $4.3 billion.
Out of this amount, the LAEDC estimates direct and indirect workers spend almost $1.1 billion annually on taxable consumer goods and services, a considerable sum indeed.
Geographic Distribution of Vernon Employees
The City of Vernon is the smallest city in Los Angeles County when ranked by population. Vernon’s economic impact, however, is far larger than one might expect. Indeed, as one of the county’s “industrial cities,” along with the cities of Commerce and Industry, Vernon is an important economic center.
Firms located within Vernon’s borders employed 44,896 people when the Vernon Chamber of Commerce took its survey (during October and November 2007). Of this number, the Chamber was able to account for 29,881 workers who resided in Southern California, about two-thirds of the total. In addition, another 292 employees worked for the City of Vernon.
Relying on the survey results for the private-sector employees and City records for the public workers, the LAEDC classified all 45,188 employees according their home zip codes. Not surprisingly, most Vernon-based workers live somewhere in Los Angeles County.
Top 15 Cities of Residence for Vernon-based Employees
(Cities with more than 500 Vernon Employees)
1. Los Angeles
2. Huntington Park
3. Bell/Bell Gardens/Cudahy
4. South Gate
5. Maywood
6. Long Beach
7. Whittier
8. City Terrace
9. East L.A.
10. Downey
11. Lynwood
12. Compton
13. Montebello
14. Pico Rivera
15. Norwalk
Of the communities list above, six struggle with high unemployment rates, ranging from 7.0% (East L.A.) to 8.9% (Compton). Many are also high-poverty areas, four marked by individual poverty rates above 20%, four others in the high teens, ranging from 18.7% (Lynwood) to 19.9% (Maywood). (these #s are based on 2000 Census info-- needs updating when info available)
The LAEDC estimates the average annual employee earnings in the City of Vernon at $41,577. Plainly, well-paying jobs in Vernon are of great value to each employee’s household welfare, and are vital to the city of their residency.
With a small retail sector, Vernon offers its large workforce little opportunity to spend their collective earnings within the City limits. Employee spending still takes place, of course, but with a higher-than-usual proportion being spent in areas near the workers homes in the areas adjacent to the City of Vernon.
Vernon’s Top 20 industries in Terms of Employment Manufacturing activities, mostly nondurable, dominate the Top 20 list, occupying 12 of the top 20 spots in the industry rankings.
1. Food Manufacturing
2. Apparel Manufacturing
3. Wholesalers—Nondurable Goods
4. Warehousing and Storage
5. Wholesalers—Durable Goods
6. Textile Mills
7. Couriers and Messengers
8. Fabricated Metal Products
9. Plastics Product Manufacturing
10. Chemical Manufacturing
11. Furniture & Related Products
12. Printing & Related Support Activities
13. Paper Manufacturing
14. Machinery Manufacturing
15. Textile Product Mills
16. Truck Transportation
17. Nonmetallic Mineral Products
18. Repair & Maintenance Services
19. Administrative & Support Services
20. Beverage & Tobacco Products
The “Top Five” Vernon industries collectively employ over one-half (actually 58%) of the City’s private-sector workforce.
Vernon’s Industrial Profile
Vernon’s industrial base is heavily weighted toward manufacturing."
About 29,600 of Vernon’s private-sector employees work in manufacturing establishments, almost two-thirds of the total. However in Los Angeles County total, only 13.4% of private-sector employees work for manufacturing firms.
The difference between Vernon and the surrounding region is most marked among manufacturers of nondurable goods, which account for close to 54% of total employment in Vernon, an incredible 9.1 times as large as nondurable manufacturing share in all of L.A. County.
The percentages of Vernon’s transportation & warehousing and wholesale trade employees also are significantly higher— 2.9 times as large for the former and 2.5 times for the latter—than the rest of the County.
Construction
A significant amount of privately financed commercial and industrial construction takes place in the City of Vernon each year.
The average value of construction permits issued during 2002-2006 was $72.3 million. The LAEDC estimates that private construction spending projects supported on average 1,015 full-time equivalent jobs each year. Construction related wages and salaries were a little over $41.2 million per year, and total taxable spending was approximately $10.3 million.
Private Sector Impacts
City records indicate that 1,590 establishments are doing business inside the Vernon City limits. These establishments directly employ 44,896 workers.
An estimated 470 more employees work on privately financed construction projects in the City. In addition, more than 58,500 indirect FTE jobs are attributable to the spending of Vernon based firms, construction contractors working on projects in Vernon, and the direct employees, for a total employment impact of 103,900 Vernon-related direct and indirect jobs.
Jobs are not the whole story, however. The LAEDC estimates that direct and indirect workers combined earn over $4.3 billion annually.
After taxes, they save some of their earnings, pay their mortgages or rent, and spend the rest on various types of goods and services.
An estimated $1.1 billion of these transactions involve the payment of sales or use taxes.
California and various local governments—counties and cities—together take in an estimated $334 million in personal income and sales tax revenues every year.
Private Sector Impact on Government Revenues
Much of the income and spending generated by Vernon related economic activity is subject to taxation by the state and various municipal governments in California.
The LAEDC has estimated about $334 million in total revenues are generated annually from income, sales and use taxes related directly and indirectly to private-sector economic activity in Vernon.
State of California
The State of California collects the lionʼs share of tax revenues associated with private sector activities carried out in the City of Vernon—about $310 million annually.
Most of these revenues are actually paid by the employees, in the form of state personal income taxes and sales taxes. The State of California also collects about $49 million in the form of SUI and SDI (State Unemployment Insurance and State Disability Insurance).
Los Angeles County and Surrounding Cities
Spending by all employees related to Vernon-based firms generates sales tax revenues for the cities and counties in which the purchases take place.
The total assessed value of property in Vernon is about $3.56 billion or 0.35% of the Los Angeles County total. The property tax revenue generated by Vernon properties (using the 1% “general levy” rate) is thus about $35.6 million annually. This revenue is allocated to LA County, the City of Vernon, and other special districts having jurisdiction in Vernon.